Over the last five years, markets have pushed concerns about debt under the rug, World Economic Forum reported.
While economic growth and record-low interest rates have made it easy to service existing government debt, it’s also created a situation where government debt has grown into over $63 trillion in absolute terms.

The global economic tide can change fast, and in the event of a recession or rapidly rising interest rates, debt levels could come back into the spotlight very quickly.
The debt snowball
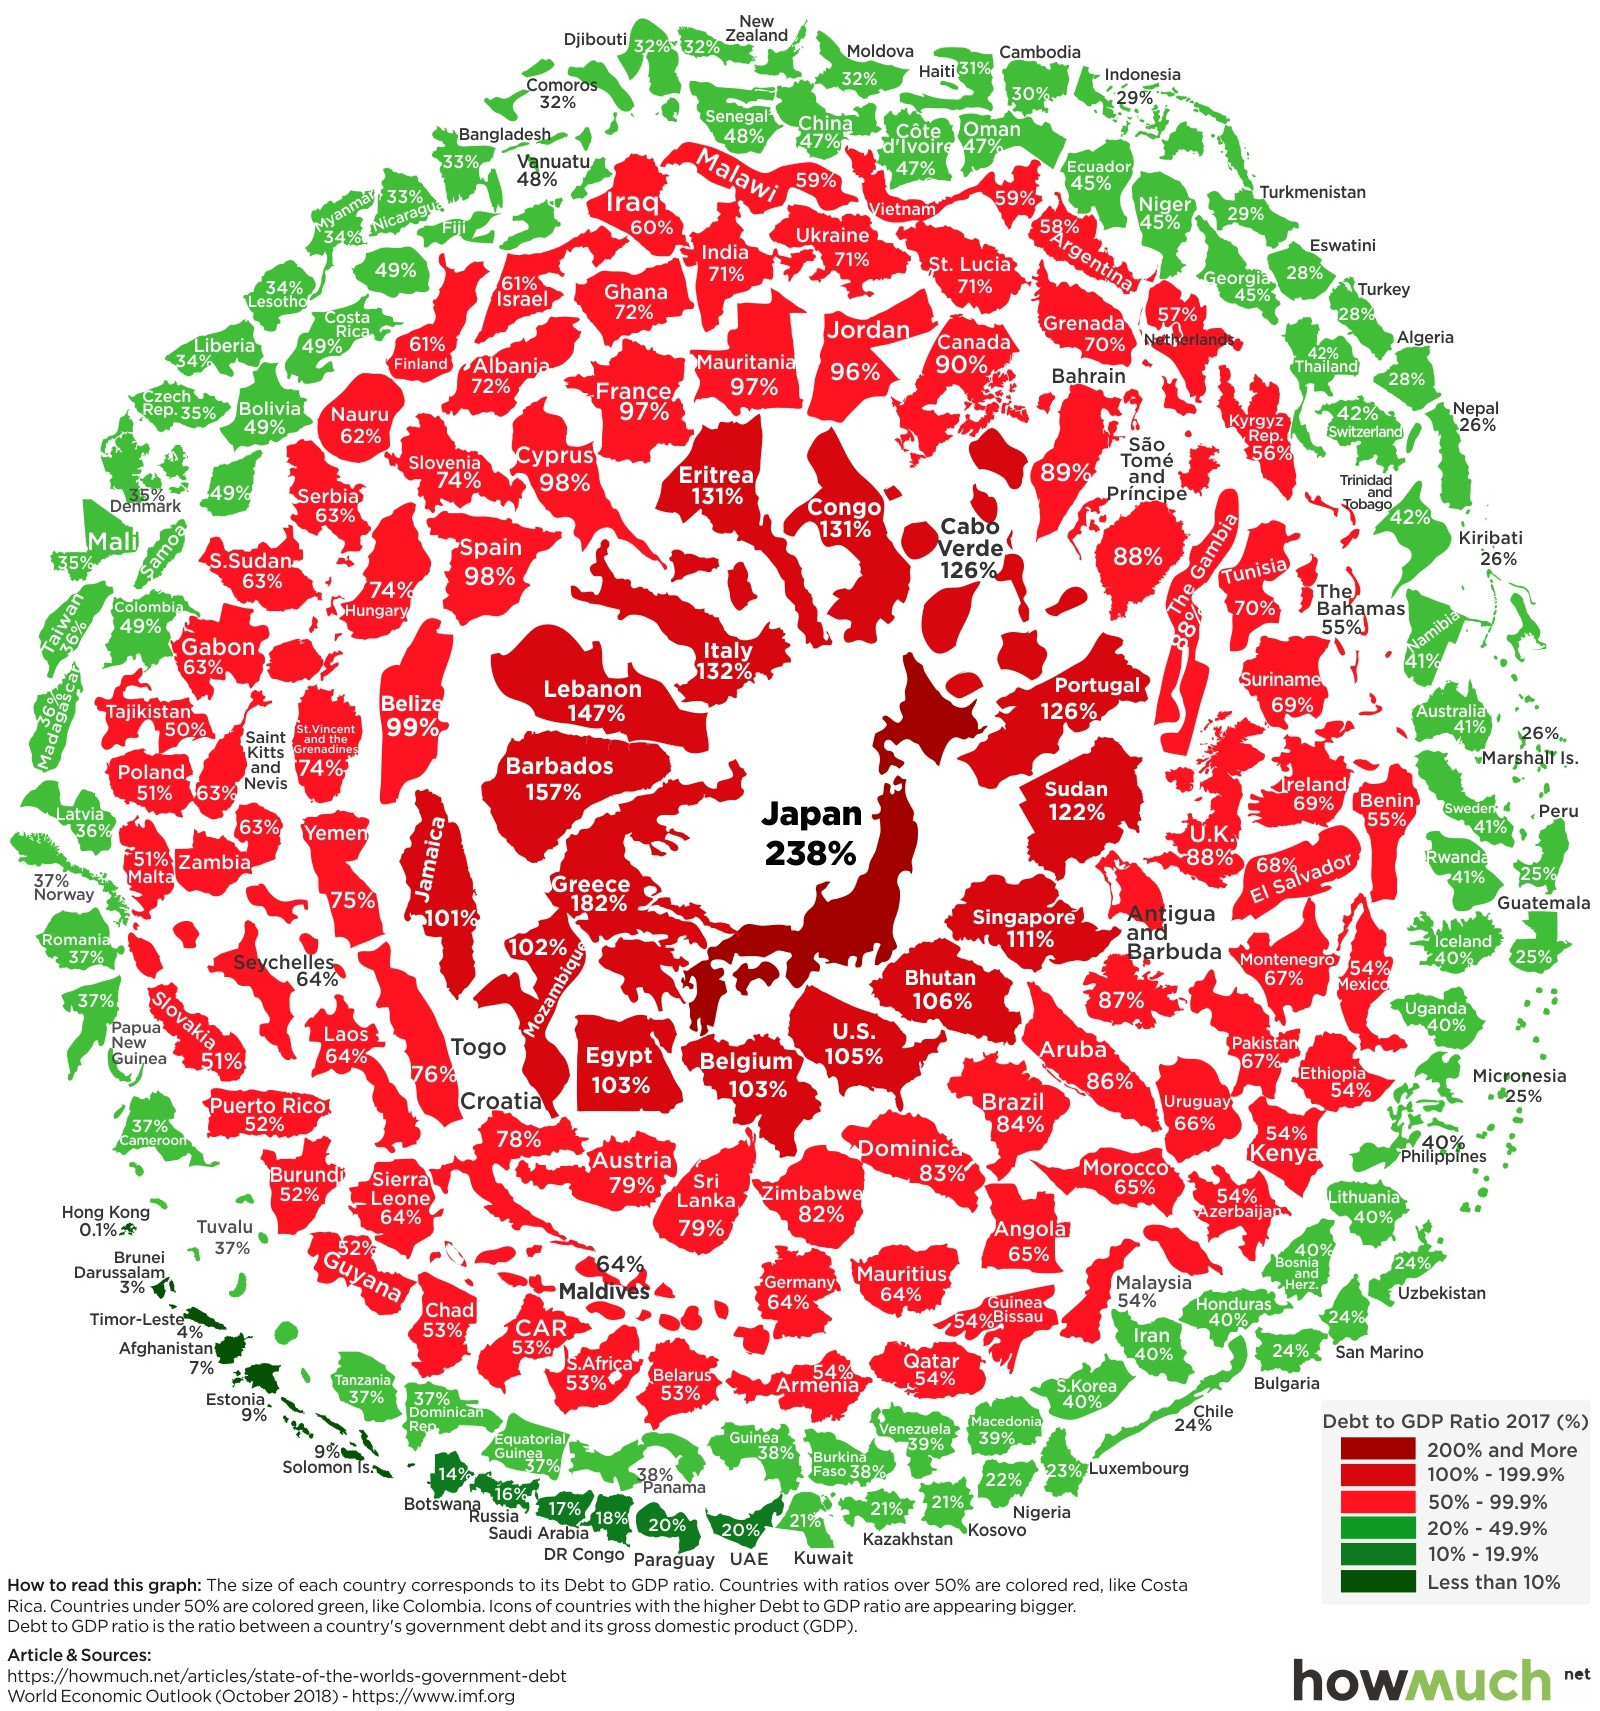
Today’s visualization comes to us from HowMuch.net and it rolls the world’s countries into a “snowball” of government debt, colored and arranged by debt-to-GDP ratios. The data itself comes from the IMF’s most recent October 2018 update.
The structure of the visualization is apt, because debt can accumulate in an unsustainable way if governments are not proactive. This situation can create a vicious cycle, where mounting debt can start hampering growth, making the debt ultimately harder to pay off.
Here are the countries with the most debt on the books:

Japan and Greece are the most indebted countries in the world, with debt-to-GDP ratios of 237.6% and 181.8% respectively. Meanwhile, the United States sits in the #8 spot with a 105.2% ratio, and recent Treasury estimates putting the national debt at $22 trillion.
Light snow
On the opposite spectrum, here are the 10 jurisdictions that have incurred less debt relative to the size of their economies:

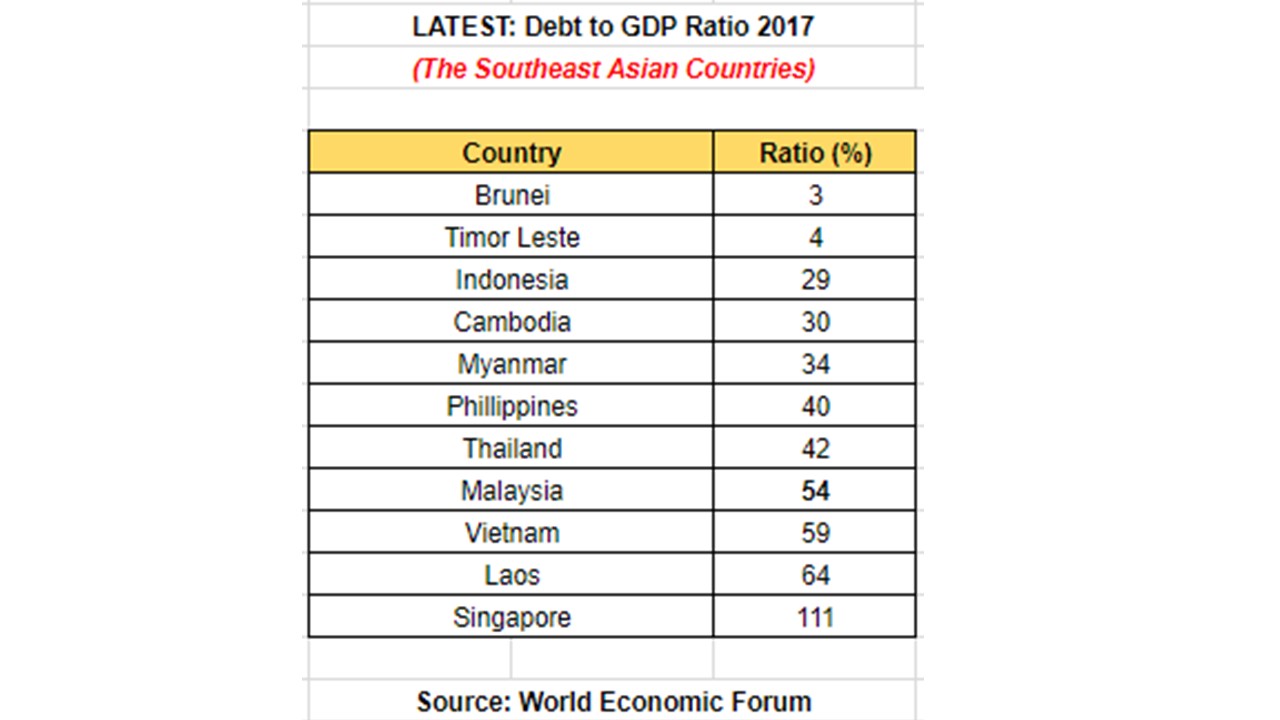
Meanwhile, herewith we attached the full list of Southeast Asian government's debt looks like:

Source : World Economic Forum


